
Special Intelligence Report:

CONSUMER INTELLIGENCE™ | COMMUNITY RESILIENCE
America’s Nonprofit Safety Net Is Uneven
A new geographic index shows why communities with a visible nonprofit presence may still lack the specialized organizations needed to respond to their greatest challenges.
Key findings
Nonprofit totals alone cannot show whether a community has the right mix of services.
Organizational diversity matters because housing, health, workforce, education, faith, and family-support systems address different needs.
A high index score signals concentrated infrastructure—not guaranteed access, quality, funding, or effectiveness.
A low score is an early-warning capacity signal, not a judgment about residents or local leadership.
At first glance, a community with hundreds of nonprofit organizations may appear well protected. But when a family faces eviction, a mental-health emergency, unemployment, food insecurity, or a sudden financial crisis, the number of organizations on a directory is not the most important question. The real question is whether the right kind of help exists, has sufficient capacity, and can be reached when it is needed.
That distinction is at the center of the United States Nonprofit Community Resilience Index, or USNCRI, a National Data System framework developed to measure nonprofit-driven community support capacity across American geographies.
The index brings nonprofit concentration, organizational diversity, faith and community infrastructure, healthcare support, housing-related organizations, labor and community networks, and educational and family-support ecosystems into a common geographic framework. The national map summarizes that capacity across ZIP3 geographies—the first three digits of a ZIP code—so broad regional patterns can be seen without reducing the analysis to state averages.
EIN-linked nonprofit records in the first-generation index source universe
ZIP5 rows in the underlying first-generation index output
Normalized scale used to compare observed nonprofit support capacity
Regional geography used for the national map view
Where nonprofit capacity is concentrated—and where it appears thin
The US Nonprofit Community Resilience Geography map displays the relative concentration and diversity of nonprofit support infrastructure across ZIP3 regions. Darker areas indicate stronger observed concentrations of nonprofit infrastructure and community stabilization capacity. Lighter areas indicate places where the observed nonprofit support network is comparatively thinner.
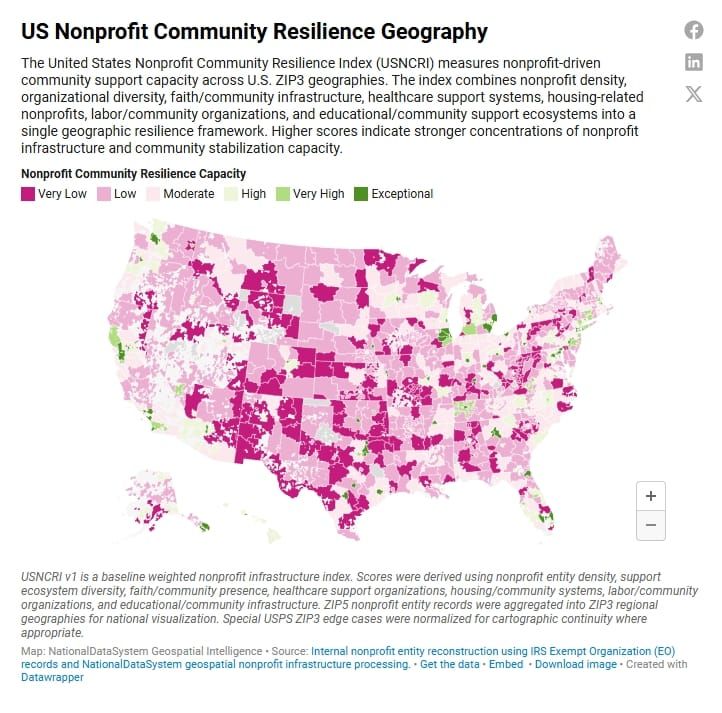
The map should not be read as a simple ranking of good and bad communities. It is a view of observed infrastructure. It helps identify where nonprofit support systems are concentrated, where regional gaps may exist, and where leaders should look more closely at the balance between community need and organizational capacity.
A crowded directory is not the same as a complete safety net
Two regions can contain similar numbers of nonprofit organizations and still offer very different levels of practical support. One may have a diverse network spanning housing, behavioral health, job placement, healthcare, food access, education, and family services. Another may have many organizations concentrated in only a few mission areas.
Faith and community
Trusted institutions can organize volunteers, communicate with residents, distribute aid, and stabilize neighborhoods.
Health support
Healthcare and mental-health organizations respond to needs that general community groups may not be equipped to address.
Housing stability
Housing, shelter, and homelessness organizations can keep a temporary financial shock from becoming displacement.
Workforce mobility
Employment, training, and labor organizations connect residents to income, skills, advocacy, and economic opportunity.
Education and youth
Educational and youth-serving organizations support long-term mobility and help families navigate critical transitions.
Human services
General and specialized services help families manage food, transportation, disability, caregiving, and crisis needs.
This is the central advantage of a resilience framework: it looks beyond organizational volume to the composition of the local support ecosystem. A region may appear well served in the aggregate while lacking the specialized capacity demanded by its most urgent conditions.
One district shows how broad capacity can conceal specialized gaps
A separate National Data System district-level analysis illustrates the issue. Across the ZIP coverage used to profile Texas House District 124 in San Antonio, the system identified 821 nonprofit records serving a district with 192,718 residents. The network included substantial faith, education, human-services, and housing infrastructure.
At the same time, the district profile identified 31,043 residents living in poverty. The contrast is significant: a broad community network exists, but the observed number of organizations specializing in employment and mental health is thin relative to the scale and complexity of local need.
Why nonprofit geography matters to consumers
Consumer protection does not end with laws, regulators, and complaint systems. When households experience job loss, debt pressure, housing instability, identity theft, disability, medical hardship, or another financial disruption, nonprofit organizations often become part of the practical response.
A consumer may have a legal right, an available public benefit, or a legitimate claim against a company and still struggle to recover without local assistance. The absence of accessible housing counseling, legal aid, workforce support, behavioral-health services, food assistance, or family stabilization can allow one problem to trigger several others.
That makes nonprofit geography a consumer issue. The strength and composition of a local support system can influence whether residents find help early, whether financial harm compounds, and whether recovery resources are available close to home.
How the first-generation USNCRI was constructed
The first-generation USNCRI was a rule-based index built from EIN-linked nonprofit records. It produced 9,504 ZIP5 rows from a source universe of 29,043 records and then supported aggregated ZIP3 product views for national mapping.
FIRST-GENERATION RAW SCORE
0.35 × nonprofit entity count
8 × nonprofit diversity score
2 × community entities
1.5 × faith entities
2 × health entities
2 × housing entities
The resulting score was normalized to a 0–100 scale and organized into capacity tiers. Labor, educational, and other service areas help inform the broader organizational-diversity and community-support interpretation; they were not all assigned separate weights in the documented first-generation formula.
The index therefore measures the concentration and diversity of nonprofit infrastructure represented in the underlying dataset. It should be used as a decision-support signal for further investigation, not as a final determination of community performance.
What the index does not measure
The source universe is also not the complete population of every nonprofit operating in the United States. A high score should not be interpreted as proof that residents can obtain adequate help. A low score should not be interpreted as evidence that a community lacks resilience. Both are signals that should be tested against current local data, actual service availability, funding, demand, and resident experience.
Questions every community should ask
- 1
Which nonprofit service categories are abundant, and which are unusually thin?
- 2
Does organizational capacity align with poverty, housing, health, disability, workforce, and demographic conditions?
- 3
How many organizations are actively serving residents rather than merely registered in the geography?
- 4
Which organizations have the funding, staffing, and referral capacity to accept additional clients?
- 5
Where could government, philanthropy, business, and faith institutions coordinate rather than duplicate services?
- 6
What specialized organizations should be recruited, expanded, or funded to close the most consequential gaps?
09 THE BOTTOM LINE
The map is a starting point for better questions
The USNCRI makes a part of America’s civic infrastructure visible. It shows that nonprofit capacity is not distributed evenly and that broad organizational presence can obscure missing specialties. Its greatest value is not declaring one community resilient and another vulnerable. Its value is directing attention to the places and service categories that deserve deeper examination.
For consumers, public officials, funders, chambers of commerce, healthcare systems, and nonprofit leaders, the challenge is clear: count the organizations, but do not stop there. Measure the mix. Examine the gaps. Compare capacity with need. Then invest where the safety net is thinnest.
Explore Consumer Intelligence
Browse our growing collection of consumer intelligence, complaint investigations, company profiles, rankings, maps, and financial research.
Complaints
Consumer complaint trends, investigations, and analysis.
🏢Companies
Company profiles, complaint history, and accountability.
📈Credit
Credit reporting, credit scores, disputes, and credit intelligence.
💳Debt
Debt collection, collections, repayment, and consumer protections.
🏦Banking
Banks, fintech, checking accounts, payment systems, and financial services.
🏠Mortgages
Mortgage lenders, servicing, foreclosures, and home finance.
💰Loans
Auto loans, student loans, payday loans, and personal lending.
🔒Identity Theft
Identity protection, recovery, monitoring, and fraud prevention.
⚠Scams & Fraud
Fraud alerts, scam investigations, phishing, and consumer warnings.
⚖Lawsuits
Consumer litigation, settlements, enforcement actions, and class actions.
🔍Investigations
Data-driven investigative journalism and consumer accountability.
🏆Rankings
Top companies, worst offenders, complaint rankings, and scorecards.
🗺Maps
Interactive complaint maps, ZIP rankings, and geographic intelligence.
🏛States
Consumer intelligence by state.
🏙Cities
Complaint trends and company intelligence by city.
📚Research
Methodologies, datasets, technical papers, and evidence.
📖Consumer Guides
Know your rights and learn how to solve common consumer problems.
🗃Data Center
Interactive dashboards, APIs, downloadable datasets, and statistics.


